| ROC Graph |
|
ROC graphs are another way besides confusion matrices to examine the performance of classifiers (Swets, 1988). A ROC graph is a plot with the false positive rate on the X axis and the true positive rate on the Y axis. The point (0,1) is the perfect classifier: it classifies all positive cases and negative cases correctly. It is (0,1) because the false positive rate is 0 (none), and the true positive rate is 1 (all). The point (0,0) represents a classifier that predicts all cases to be negative, while the point (1,1) corresponds to a classifier that predicts every case to be positive. Point (1,0) is the classifier that is incorrect for all classifications. In many cases, a classifier has a parameter that can be adjusted to increase TP at the cost of an increased FP or decrease FP at the cost of a decrease in TP. Each parameter setting provides a (FP, TP) pair and a series of such pairs can be used to plot an ROC curve. A non-parametric classifier is represented by a single ROC point, corresponding to its (FP,TP) pair.
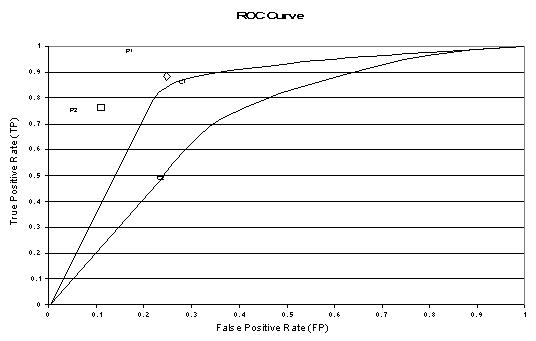
The above figure shows an example of an ROC graph with two ROC curves labeled C1 and C2, and two ROC points labeled P1 and P2. Non-parametric algorithms produce a single ROC point for a particular data set.
Features of ROC Graphs
Area-based Accuracy Measure
It has been suggested that the area beneath an ROC curve can be used as a measure of accuracy in many applications (Swets, 1988). Provost and Fawcett (1997) argue that using classification accuracy to compare classifiers is not adequate unless cost and class distributions are completely unknown and a single classifier must be chosen to handle any situation. They propose a method of evaluating classifiers using a ROC graph and imprecise cost and class distribution information.
Euclidian Distance Comparison
Another way of comparing ROC points is by using an equation that equates accuracy with the Euclidian distance from the perfect classifier, point (0,1) on the graph. We include a weight factor that allows us to define relative misclassification costs, if such information is available. We define ACd as a distance based performance measure for an ROC point and calculate it using the equation:
![]() [22]
[22]
where W is a factor, ranging from 0 to 1, that is used to assign relative importance to false positives and false negatives. ACd ranges from 0 for the perfect classifier to sqrt(2) for a classifier that classifies all cases incorrectly, point (1,0) on the ROC graph. ACd differs from g-mean1, g-mean2 and F-measure in that it is equal to zero only if all cases are classified correctly. In other words, a classifier evaluated using ACd gets some credit for correct classification of negative cases, regardless of its accuracy in correctly identifying positive cases.
Example
Consider two algorithms A and B that perform adequately against most data sets. However, assume both A and B misclassify all positive cases in a particular data set and A classifies 10 times the number of infrequent itemsets as potentially frequent compared to B. Algorithm B is the better algorithm in this case because there has been less wasted effort counting infrequent itemsets.