1995 Fractals Calendar
I edited the
1995 Fractals (1996 The Art of Fractals)
calendar
as a Ph.D. student at Simon Fraser University.
The calendar featured contributed images from
Danielle Bercel, Michael Field, Martin Golubitsky, John C. Hart, F. Kenton Musgrave, and Lewis N. Siegel.
This calendar was completed with the assistance of the Centre for Experimental and Constructive Mathematics and the Graphics and Multimedia Research Laboratory at Simon Fraser University. Earlier work was done at the University of Regina and at the IBM Thomas J. Watson Research Center.
There are many to whom I continue to be grateful, but especially B. Mandelbrot, K. Musgrave, P. Prusinkiewicz, D. Saupe, and R. Voss.
January: Snowflake in Winter
von Koch's snowflake curve, an early mathematical monster, is depicted here in friendlier surroundings. The blue visible amidst the spheres is what remains after an algorithm to cover the complement of the fractal is applied. It works by finding the minimum distance of d of a point x from the fractal then drawing a disk of radius (maybe less than) d centered at x. Since any point already inside a disk cannot be part of the fractal, the algorithm progresses quickly as the complement is covered by disks. The spheres are the three-dimensional extensions of those disks. A fractal texture is applied to the spheres to create snowballs — the making of which is a common pastime during long Canadian winters. The snowflake curve is based on an equilateral triangle, of which each side is divided into three parts then replaced by four parts of the same length, and so on.
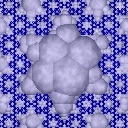
February: Chaotic Quilt
Although chaos would seem to be the antithesis of symmetry, it is possible to find elaborate symmetric patterns in chaotic processes. Shown here is a hexagonal pattern similar to those that sometimes appear on quilts. This image is produced by iterating a map with hexagonal symmetry. Although the iteration possesses all the features of chaos, a surprisingly detailed and intricate symmetric pattern appears when we take a very large number of iterations — in this case about six billion — and color each pixel according to the number of times it is visited during iteration. In this sense we are computing an averaged picture. The colors themselves were chosen for their artistic effect. Note that the detail inside each of the hexagons happens to resemble a flower. The fractal quality of the picture is to some extent represented by the reappearance of the hexagonal symmetry on ever-decreasing scales.
March: The Great Fern Dune
This fern dune is one of the natural wonders on this distant world. The fern leaf is defined by a set of linear transformations, sometimes called an iterated function system. The sand dune which surrounds the leaf was created by evaluating a so-called escape-time function for the fern and subsequently interpreting the values as heights. The escape-time function works by determining whether a point escapes membership in the fern, and if so then how quickly. The fern shape at the top of the dune reveals the accuracy with which that question was answered here. More points are included than might otherwise be expected since it is easier to exclude points than verify their membership. The scene is made more believable by the use of fractal textures for the clouds, moon and sand. The technique for interpreting function values as heights is effective for adding a third dimension to two-dimensional data, and has been employed to great advantage in many earlier fractal images.
April: Rare, Long-Stemmed, Speckled Gigantic Flowers Slowly Advancing, Variation #1
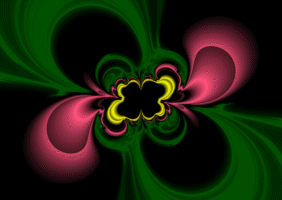
This image is the result of a two-year metamorphosis from the image shown below [not shown], entitled Rare, Long-Stemmed, Speckled Gigantic Flowers Slowly Advancing. The title of these images is a partial quote from Karen Blixen's novel Out of Africa. From inspection, one may see that both pictures depict the same fractal and that they share virtually all the same coordinates and parameters. The roles of color and black (or monotones) between the two images are reversed. Areas black in Variation #1 were colored according to logarithmic function in the original and monotone areas in the original received an algorithmic coloring. The form of the original is still visible in Variation #1, but it has been de-emphasized. The images are based on a variation of the usual formula describing Julia sets: zn+1 = zn2 + c, where one may adjust the value of c (a complex number) as a parameter to obtain different images. In the variation, a function is added to the mix and becomes another parameter for manipulation: zn+1 = f(zn) + zn2 + c. For these images, the conjugate of a cosine function was used. While I still prefer the original picture, as a parent might feel for a child, it appears that almost everyone who has seen both of these pictures prefers Variation #1.
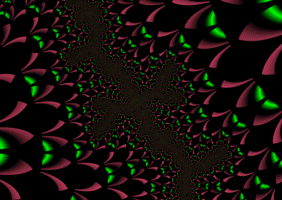
May: Mandelbloom
It has been observed, by Mandelbrot and others,that fractal forms are found abundantly in nature. In this spirit, Mandelbloom shows natural forms occurring in a fractal. The image was created with a method used to show how the Mandelbrot set evolves over time. To create an image of the Mandelbrot set, points in the complex plane are iterated according to the well known function Zn+1 = Zn2 + C. The structure in Mandelbloom comes from an attempt to capture the movement of these points at a particular moment in time. In traditional renderings of the Mandelbrot set, each point in the plane is iterated until it escapes from the neighborhood of the origin, or reaches an upper limit. The number of iterations is then utilized to generate a color for the pixel which represents that point. In Mandelbloom, each point is instead iterated exactly the same number of times, and each point's location in the plane is used to color the pixel. With this method, a procedural texture is used to associate a color with every point in the complex plane. Rather than calculating colors for the pattern, color values are read from bitmaps of either the stem or the rose.
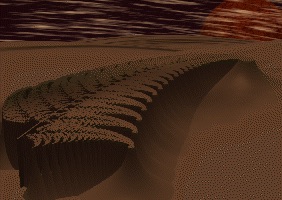
June: Humble Aspirations
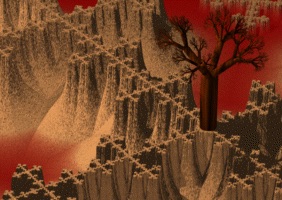
In the midst of the harsh surroundings, a lone tree struggles for life. Each element of the scene modeled here employs fractals to shift attention from the mathematical details of the model to the illusion which it creates. The terrain is created from instances of a height field derived from a planar linear fractal, [not] shown below. The density of the fog which covers this desolate land is modulated by a fractal function. The tree, though idealized, does incorporate some observations from nature which, along with a wood texture, add to its realism. Every branch in the tree is created by linearly transforming the trunk. Beginning with a very concise description, the model is expanded to include over 150,000 primitives for rendering.
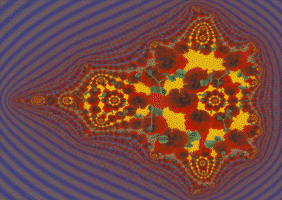
July: Untitled #7
This image takes a portion of the standard Mandelbrot set as its starting point. The portion chosen, shown at a relatively low magnification factor of 414 in Untitled #7 n-2 (top image below [not shown]), seems rather boring with little to recommend it. However, at a magnification factor of about 40,000, as seen in Untitled #7 n-1 (bottom image below [not shown]), this same location reveals the familiar shape of the Mandelbrot set and its lake. Even at relatively low magnifications, images of fractals can be made more interesting by bringing out other details and the main image is the result applying one such technique. Points outside the Mandelbrot set will "escape" to infinity after some number of iterations, and this number is usually called the escape time (points which have not escaped after the maximum allowed number of iterations are considered to be part of the Mandelbrot set). Traditionally in images of the Mandelbrot set each point represented in the image is colored according to this value, but I have also experimented with several alternatives. One may determine the color by making use of the real component of the location at which the point was deemed to have escaped (the Mandelbrot set resides on the complex plane and so each point on the plane has both real and imaginary components). Another technique which can be used to determine color is based on the quadrant of the complex plane in which escaped points first land. The result is a sort of curved-space checkerboarding of color, as points belonging to a single contour may take on any one of four colors depending on the point of departure for the escaping point. To this, an additional logarithmic coloring algorithm is applied to produce smooth color transitions.
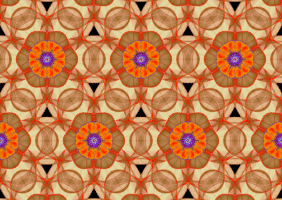
August: Fractal Quilt
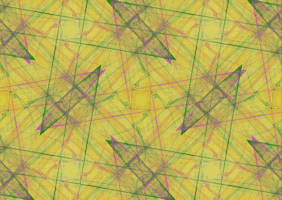
Fractals can be created to mimic the real world and they can also be used as a source of pattern generation. Combining fractal methods with symmetry leads to a method for creating many kinds of repeating patterns. The seventeen different symmetry types of planar repeating patterns were classified formally by Federov in 1891 — but their existence has been known for centuries. Indeed, each of these patterns appears in the Alhambra, a group of buildings overlooking the city of Granada that was constructed by the Moors in the thirteenth and fourteenth centuries. Only more recently have mathematicians considered how many different ways there are to construct two-color planar repeating patterns — there are forty-six possibilities. A two-color repeating pattern is one in which half the symmetries of the figure preserve the colors while half the symmetries interchange colors. Fractal methods have been used to create this large two-color fractal quilt. It is amusing to check whether you can, in fact, identify all of the symmetries in this figure. (Besides the translations, there are eight symmetries — four preserve colors and four interchange them.)
September: A Crop Circle on the Palouse
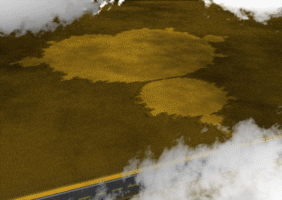
This image demonstrates recent advances in computer graphics at modeling supernatural phenomena. This crop circle, that might have otherwise been the result of a UFO encounter, as actually created using a technique called procedural geometric instancing. It allows a new representation for procedural models, which are typically translated into simpler polygonal representations for rendering. The usual unorganized polygonal representations can be unmanageable due to size. Procedural geometric instancing encapsulates procedural components into the geometric representation, which are evaluated on demand during rendering. The crop circle, containing over 100 million primitives, was specified by a short description file which represents the field of wheat with a CSG (Constructive Solid Geometry) hierarchy of instances of a single wheat stalk which may or may not bend over, depending on the location into which it is instanced. Given this position, a simple lookup in a low-resolution "crop map" of the Mandelbrot set determines whether the UFO should bend the stalk or not.
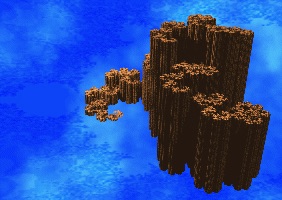
October: Dragon's Lair
A dragon curve is captured here in what may be its natural habitat. The brooding dragon curve remains after its complement has been covered by the blocks which form the walls which enclose it. The primitives are not spheres, as before, since the Manhattan distance function is used in place of the usual Euclidean. This means that distance is calculated x+y rather than x2 + y2 and so diamonds in the Manhattan metric fill the same role as circles in the Euclidean metric. To create the third dimension in this image, boxes with height proportional to the size of the original diamonds were used. The sharpness of these boxes and their shadows provide an interesting contrast to the apparent roughness of the dragon curve, created with a fractal texture.
November: Barque
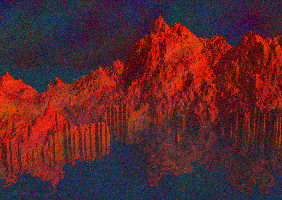
A shortcoming of computer-generated images is often that they lack the level of visual complexity of a photograph or a painting. An impressionist painting, for instance, can have a rich variety of color in each brush stroke; furthermore, paintings always have a textured surface, and a painter is likely to modulate the color of an otherwise flat field of color, such as a blue sky. In Barque a variety of fractal methods are used to obtain similar visual complexity. First, we start with a fractal mountain and fractal water, as seen in the image [not shown] below. Then a fractal color perturbation, as seen in the second image below, is applied to the mountain and to the sky. Finally, a fractal post-processing filter is applied to the image to create a pointillist effect. This filter samples the color of the image at a particular location, perturbs that color with a fractal distribution, then replaces a small area with a spot of the perturbed color.
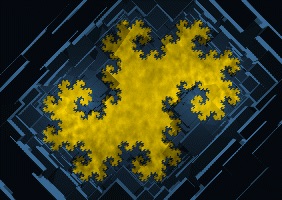
December: Steps to Infinity
Floating in space, this fractal staircase leads toward a perception of infinity. Each step in the staircase is both a small copy of the whole shape and a collection of many smaller copies of itself, which illustrates the key concept of self-similarity. The fractal, called a dragon curve, is formed by iteration of just two linear transformations. Each step in the staircase can be identified by a common sequence of transformation applications. By labeling the transformations with 0 and 1 and recording how they are applied, one can associate a binary number with each step — used here to assign heights. The staircase looks somehow natural but the shape is more regular than would be found in nature. Like many fractal objects, it possesses a sense of familiarity. The clouds in the sky are also fractal, but they represent an example of stochastic fractals — in contrast to deterministic fractals like the staircase or the omnipresent Mandelbrot set.