


|
Walking the Data Cube | |
Author: Ayman Ammoura, University of Alberta
Supervisor: Dr. Zaiane, University of Alberta
A data cube is a multidimensional presentation of data; while each dimension represents an entity by respect to which the data is to be organized, the value held at each cell of the cube represents a data aggregate that is called a theme or fact. Each dimension in the data cube can be further described by a concept hierarchy that allows interactive data mining on various levels of abstraction. In this project an application is developed in which a data cube is generated in a virtual reality environment. The user is able to walk through the different cuboids and perform operations of drill-down and roll-up. This is a report that will briefly discuss the project and ment to be a technical description of the work. If you are interested in working in such an environment please feel free to send an email to ayman@cs.ualberta.ca stating this request. I will be happy to provide any help possible.
1. The Problem Definition
We wish to capitalize on the fact that humans are visual beings by presenting data aggregates in an interesting manner. Given a file that contains financial transactions, the data cube has to be generated and presented in some data structures. To be able to perform the OLAP operations of roll-up and drill-down, a concept hierarchy must be present to outline the different levels of summarization. The visualization will be performed in the VizRoom which is a very large scale virtual reality environment in which the user will be given the illusion of an actual movement in the drawn world. Here the term "world" defines the set of all graphical objects that are rendered to the display system. This implies that the location of the user has to be detected and update the image accordingly. To give a realistic and useful presentation of each cuboid, the size of these cuboid will be used as a significance cue. The color of the cuboid is also a valid cue that could be used by data mining to signal an underlying irregularity. Another interesting problem that is addressed is who to create an active input device that that user can use to specify a selection for example.
VizRoom is the name chosen for the virtual reality room at the University of Alberta, which remains the only one in Canada to date. The Graphics are generated by a 4-processor ONYX SGI computer (1000 MIPS). The images generated are in stereo with refresh rate of 120 frame/second.
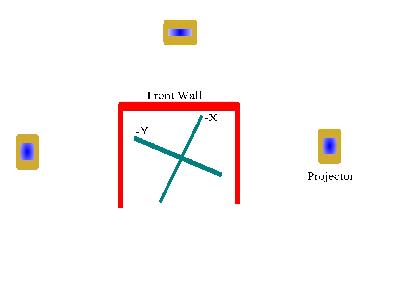
These images are delivered via 2 graphics lines one for the front wall and one for the two side walls. To provide the depth effect, stereo is graphics are used. The user wears a special shutter glasses that selects the right eye image from the left eye image. There are several types of input devices that used as trackers to detect the location of the user with in the three walls using electromagnetic signals. The two that are used for this project are a head tracker which is attached to a hat that the user wears and a hand held tracker with three buttons. These trackers provide a continuous signal that is a function of its position from the origin (the intersection of the x-axis and y-axis). In order to free the CPU, these signals are fed into a PC which process the information and sends it to Cadomin via a fiber optics link.
The three walls that make up the graphics surface are an impressive 7 feet high and 7 feet wide back projected screens. Three electrolyte projectors, P1, P2 and P3 are used. The coordinate system assumed by the MR-Toolkit is that shown in the figure, which is tilted about 30.5269 degree from the room coordinates. Please note the orientation of the negative x-axis and the y-axis, knowing this could prevent days of debugging.
3. Software and Development Environment
The software that is to be used extensively for this project is OpenGL since it is the standard in high end computer graphics. OpenGL provides a platform free environment (The Open part) which is needed since the project is to be designed on SGI work stations first and occasionally port it to the VizRoom. It provides only graphics library (the GL part) not the windowing needed for the actual display of the work. This means that a windowing toolkit is to be used to initialize the graphics sequence, setup the window and refresh the screen whenever needed. The most commonly used such kit is the GLUT package which is commonly available on many SGI work stations. In the VizRoom however, many considerations that are unique to that environment must be handled, such as the size of the display, stereo imaging and sensory input. GLUT is not equipped to handle this kind of environment, so MR-Toolkit was developed.
4. Development Stages (Visualization Component)
In this section we shall give a quick description of the development process involving the visualization portion of the project. This process consists mainly of writing several stand alone components that deal with a given problem such as input and transformations according to motion. These parts were kept apart in the early stages since this is a learning process and the behavior of these components was not completely understood at the time of development. For the person who is interested in developing a similar application the progress reports *link provide more details on the first stages of the development and contain links to the sources used for this project.
4.1 OpenGL
Naturally, the first step in the project was learning OpenGL and GLUT. The main source of information was the OpenGL programmer's guide link "The Official Guide for Learning OpenGL". This book provides a detailed description of the entire library functions with many illustrations. One of the most important concepts to understand in OpenGL is the concept of "world". In primitive graphical system, the majority of the time invested in the development is used in clipping and coordinate tracking. This means that the programmer has to be constantly aware of the coordinates of all the objects in the model being drawn. With OpenGL all that the programmer has to provide is the shape and relative position of the objects, the actual coordinates will be generated internally. Once comfortable with this concept, one can build the model with no regard to what will be actually "seen". If it exists in the model then it can be seen by simply translating, rotating the world.
Another important advantage of using OpenGL is that at any given time the viewing *def volume can be immediately adjusted to provide different "points of view" enabling the application to provide a localized subjective viewing or a perspective wide view. In this project, after experimentation, a moderation in between the two solutions was adopted. These are the parameters used.
fov 85
clipping 0.05 10.0
As part of the first phase, a small program was written in OpenGL that performs simple animation.
4.2 Porting
In theory, a program written using OpenGL library can be ported to VizRoom in a matter of hours. This is true in the sense that, yes something will run. In practice however it takes a along hours to scale the graphics correctly when the movement of the user is to be taken as input. On the SGI work stations the user's movement was simulated using the keyboard as following:
case 'f' : curr_z = curr_z + fwdThreshold; /* Forward move */
glutPostRedisplay();
break;case 'b' : curr_z = curr_z - fwdThreshold; /* Backward move */
glutPostRedisplay();
break;case 'l' : curr_x = curr_x - sideThreshold; /* Left move */
glutPostRedisplay();
break;case 'r' : curr_x = curr_x + sideThreshold; /* Right move */
glutPostRedisplay();
break;case 'u' : curr_y = curr_y + upThreshold; /* Upward move */
glutPostRedisplay();
break;case 'd' : curr_y = curr_y - upThreshold; /* Downward move */
glutPostRedisplay();
break;
Notice the heavy use of GLUT calls after every move. This is necessary to force the display update. The above will have to be changed so that the input to be taken from the user instead and asking MR-Toolkit to update the image instead of GLUT. The first application that was developed using GLUT and then ported to VizRoom produced a basic grid through which the user can walk using the keyboard as shown above. A typical view of this running is shown in the snap shot.
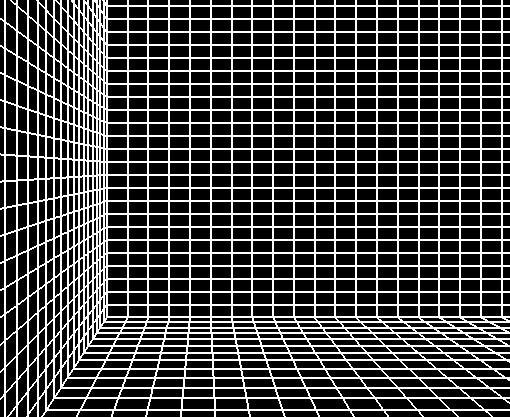
After successfully porting this application, the remaining of the objects were added on.
4.3 Tracking the User
In this subsection the problem of tracking the user is discussed. The user of this application will be wearing an electromagnetic device that will continuously emit its location. These tracker signals are received and processed by a PC in order to free the main computer. Each tracker is declared as an MR_Device structure that maintains the signals of the PC in the appropriate fields as shown:
These MR-Object are defined in mr.h:
struct MR_device_struct { // This is the tracker structure
int entry;
Eye value;
Hand glove;
int trigger;
};
typedef struct MR_device_struct *MR_Device;
struct MR_eye { // This is the structure that is updated by the computer processing the tracker signal
float x, y, z;
float quat[4];
float rx, ry, rz;
};
typedef struct MR_eye *Eye;
The fields x, y, and z in the second structure are the fields that maintain the actual coordinates.
4.4 Drawing
Now that we know where the user is, what are we to do? As mentioned earlier, the goal is to immerse the user in this virtual reality environment. To perform this, the graphics rendered to the screen must be constantly transforming in correspondence with the users movements. The information obtained in 4.3 will be used to translate the world closer or away from the user depending on the desired effect. For example, with the co-ordinate system of VizRoom in mind, a decrease in the x-value indicates that the image is to be translated positively along the x-axis, thus giving the illusion of a forward motion. In general this can be formulated as:
The above code updates the tracker position (1) and based on the size of the world each step can be "magnified" to cover more distance (2,3,4). The OpenGL calls in (5, 6, 7) will perform the actual drawing of the new resulting image. The motion_sensitivity should be kept as a function of the number of cuboids present in the world. For instance, if the user is viewing the data cube from a very high summary level then the world will consist of few cuboids and there should be no problem to walk through all of them in the space provided between the three walls. Now consider the situation in which the user is viewing the lowest summary level (in our case 7980 cuboids!), then the physical area should be utilized in a way the enable the user to see as much as possible of the VR world. A word of caution is due here., there is no one magnification constant that is going to work for all applications. There is a fine line between functionality and confusion. In our case, if we over magnify the user's motion in order to cover the entire VR world then due to the stereo effect, the user may feel physically sick.
4.5 A Solution To the Pointer Problem
So far so good, we have created a data model that the user can walk through and visualize the data. How can the application interact with the user? The answer to this question is not trivial since man/computer interaction in VR world is the topic of an active research area. With this in mind and with time considerations a simple input method was developed. In our application the user can carry a second E.T., besides the one they wear, with three buttons attached. The three buttons are treated as MR-Objects as above with the difference that instead of sending a continuous signal they merely triggers an event that can be handled by the application. The coordinates that are sent by the tracker itself are then used to draw a point in the world that moves (points) to different objects according to the hand motion.
Having succeeded in displaying the pointer and reacting to the trigger events, the application is free to interpret those events as input cues. As we will discuss later, the position of the pointer in the vicinity of a cuboid can be interpreted as a select feature. Once a cuboid is selected, one possible action to a given button event is to pop a menu or perform a dice operation.
5. Development Stages (Data Cube Component)
In the above discussion we have illustrated the visual part of the project that uses an under laying frame work in which the entire data cube is generated. This component was developed separately for reasons discussed in (6). In this section we shall give a brief description of the code written in mine.c
Before we begin we should clarify what we are trying to accomplish.
5.1. Problem Definition
We are presented with a data file that contain sales transactions for several years, products and locations. We are also presented with a description of the concept hierarchy for each of the dimensions. From this information we are to create the associated data cube using group-by operations. The theme of the data cube will be the total sale for a company with 10 locations that sells 16 products over a period of 4 years. Although this is by no means a real life example, it more that sufficient to demonstrate the main concepts in a large scale implementation.
5.2 The Concept Hierarchy
The data cube to be generated has 3 dimensions, time , location and product. Each of these dimensions has different levels of summarization. That is, the user is able to take a quick general view of that data and when ever desired can change that into more detailed view to inspect the specifics. The time dimension varies between years and months, the location varies between country and region while the product dimension varies within product category, product type and product name. For example, a drill-down operation on time will take the user from years to months, while a roll-up operation on product may reveal the product type from the product name. The following tables include the entire set concept hierarchies used.
| Product Category | Product Type | Product Name | Product ID |
| Office | Computers | IBM | 0 |
| Office | Computers | Compaq | 1 |
| Office | Computers | Apple | 2 |
| Office | Fax | Panasonic | 3 |
| Office | Fax | Brothers | 4 |
| Office | Copier | Cannon | 5 |
| Office | Copier | Xerox | 6 |
| Appliance | Kitchen | Brawn | 7 |
| Appliance | Kitchen | Sharp | 8 |
| Appliance | House | GE | 9 |
| Entertainment | TV | 27" Television | 10 |
| Entertainment | TV | 37" Television | 11 |
| Entertainment | Home Stereo | 100W Systems | 12 |
| Entertainment | Home Stereo | 500W Systems | 13 |
| Entertainment | Car Stereo | 3.9 Speakers | 14 |
| Entertainment | Car Stereo | Subs | 15 |
| Country | Region |
| Canada | Maritime |
| Canada | Quebec |
| Canada | Ontario |
| Canada | Prairie |
| Canada | North |
| USA | East |
| USA | West |
| USA | Central |
| USA | Alaska |
| USA | South |
5.3. Synthetic Data and Actual Transactions
The data used by the mine.c program is synthetic and random; however, all the functions designed with flexibility and future expansion in mind. For example, the sales transaction for every locations and every product are obtained by a call to the function:
void get_monthly_sales();
This function will generate the transaction in memory at random within a specific range. To be able to read-in a file that contains actual data transactions all that has to be done is modifying this single function. Once the data has been read, the entire cube can be generated and either kept in memory or on disk. In our application the requested cuboids are generated on the fly and stored in the array:
int aggregate [48][16][10];
The size shown here is the maximum possible given our concept hierarchy. Again, this is easily adjusted to accommodate various concept hierarchies. The way that the group-by work is by using the information in the concept hierarchy and setting the loop counter variables accordingly. Here are the three highest level group-by functions.
int groupby_year_country_pCat () {
int groupby_year_country_pType () {
int groupby_year_country_pName () {
Also here are the three group-by functions that will provide the lowest level of summary:
int groupby_month_region_pName(){
int groupby_month_region_pType() {
int groupby_month_region_pCat() {
5.4. Efficiency Considerations
One of the papers (1) that was presented this in the data mining course, by Ayman Ammoura, studied the various ways in which the the computation of the data cube can be increased. This becomes especially important in our case since we are dealing with an application that requires a huge amount of the CPU time. Since it is the intent to scale up this project to work with real life applications, the disk scan optimization measure was taken. In an ideal situation, the cubes that are generated on the fly at low levels of summary should be kept either in memory or on desk. When a request arrives for a cuboid, the parent of that cuboid can be used in the calculation instead of accessing the entire data set. This has been implemented in all the high level group-by functions:
int groupby_year_country_pCat () {int temp [4][3][2]; /*t, p, l */
int p, l, y, m, sum;groupby_month_country_pCat ();
for (p = 0; p < 3; p++) . . . . .
... etc.
In the above example notice the use of the parent cuboid (month_country_pCat) in the calculation of the cuboid (year_country_pCat). This will only involve the aggrigation of 288 entries instead of 7680 transactions.
5.5 Testing
Proving the correctness of this component by adding the aggregates manually is very difficult! For testing this component, all sale transactions were set to $1 value and all cuboid were generated and printed. With this type of data it is very easy to visually scan the columns and check.
6. Notes on Design
The design of this project was influenced heavily by the nature of the environment and by future expansion. As mentioned above, the application was written in two main parts . In VizRoom the machine time is limited since there is only one direct console. Although it is possible to remotely login and work on Cadomin, it is not possible to view the graphics remotely. Another reason for keeping the components apart is the fact that if there is a problem with the graphics then it is not immediately known whether it is the graphics or the data mining routines that are at error. Keeping both components separate also helps in organizing the problem into smaller sub problems.
All the variables and constants of the graphics routines were as little as as simple as possible. This was done so that the merge of the two would be simple and fast. The functions in the data mining side where organized in such a way that the enhancement of the system does not require the rewriting of all functions.
7. Putting it All Together
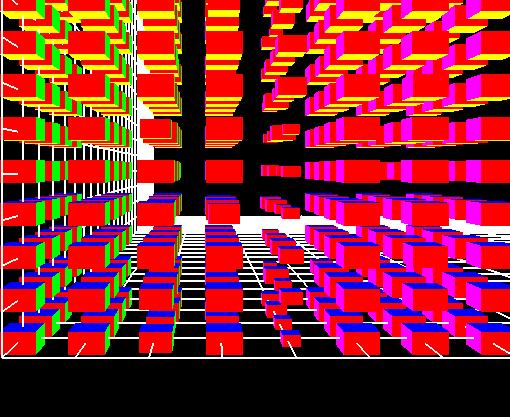
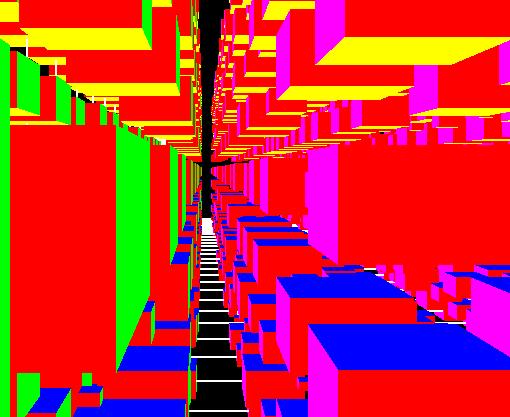
When the program runs, the user is presented with the data cube that models the level of abstraction of years, product category and country. Each cell itself is represented by a multicolor cube. The figure shown here is an actual snap shot of the running program taken from "a distance", note the size of the cubs. One can think of those cubes as the value of a function f(x,y,z) which assigns an aggregate to every (time, product, location) tuple. The three buttons on the tracker, corresponding to our 3D data model, are used to "flip" through the drill-down operations until the lowest level has been reached, after that point, the trigger of the button will perform a roll-up to the highest level and so on. In the attached figure, the 8 product types can be seen from left to right, the 10 regions are along the height axis and the years are along the depth axis. Consulting the concept hierarchy table above we see that this corresponds to the lowest level of abstraction on location, and highest level of abstraction on time. Although the 3D pointer is not used as an input device yet, it exists in the world and the user can move it within the cubes seen here.
There are two important related facts that have to be considered when developing an application such as this. The first is that as the summary level gets higher the aggregate values tend to increase significantly and the second is that the size of the cube is a cue to its value (aggregate). What does this mean, and how does it affect this work? It should be clear that the size of the cube can not be implemented as a linear function of the aggregate. What is needed here is a scaling function that is derived as following:
vizMin: The minimum "appropriate" size of a cube.
vizMax: The maximum "appropriate" size of a cube.
datMin: The minimum aggregate in the current view.
datMax: The maximum aggregate in the current view.
datDelta: datMax - datMin.
vizDelta: vizMax -vizMin.
cube_size = ((aggregate - datMin)/ datDelta) * (vizDelta + vizMin)
This is important since static scaling fails drastically. Once a signal to generate a cuboid is received the following steps are taken:
With that the screen is refreshed and updated.
7.1 More Snap Shots
Here we will present some typical scenery that one can expect while walking through the data cube or flying near by. In order to be to present these images here the .map file had to be modified so that stereo is disabled. We start with another view of the world as it can be seen from a distance. This image is translated in two directions on a large scale so that it can be attached as an image. The summary level here is (month, pType, region)
Please note that due to clipping, not all the data along the depth axis (month) is present. In the next snap shot we can see the world from the users perspective as they walk within the three walls in VizRoom.
Imagine this image in stereo as it surrounds you from three directions and moves towards you. The relative sizes of the cubes becomes more and more significant as you approach.
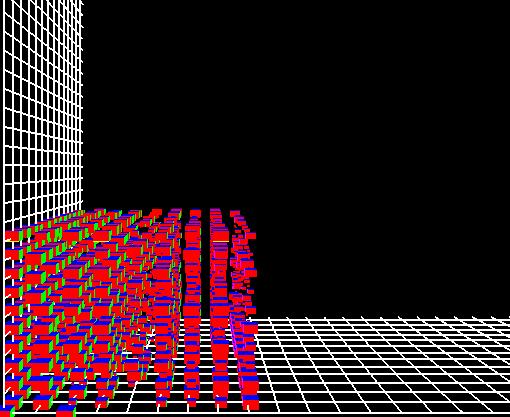
Now if you get tired from all the walking and decide to sit down on the floor you will probably see something like this following image.
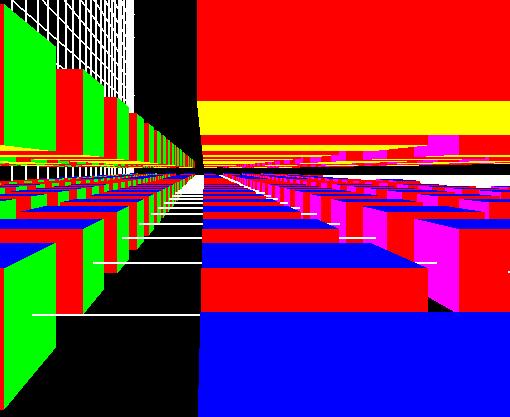
Compare the grid lines on the floor between the last two images, the vertical distance becomes more obvious. The last image represents the summary level (month, product type, country).
8. Known Bugs and Limitations
There are no known bugs in this application. The relative size of the cuboids when displayed should be improved by examining the range of the available data and then scaling accordingly. The reaction to the users motion through the environment is constant in the current application. A better solution will involve adjusting that to cover as much distance in the VR world as possible. The use of color to reflect large variances in the data will have greatly improve the use of the application. Due to time constraints this was not implemented.
Displaying text was proven to be a difficult problem. The main reason for this is that text does not exist in a 3D graphics environment. The choices are either providing image files for every letter in the alphabet and use texture to write or draw the alphabet only on the z-y plane. The later was attempted and the code that was written worked with GLUT not with MR-Toolkit.
9. The Sequel
This project will be completed by the end of April to include real life applications such as:
10. Lessons Learned
Working in the VizRoom is very interesting and can get frustrating at times. It is unique and the applications can cover very large areas of research and science. The software used in VizRoom is very powerful given that one knows where to find the right answers. In this section a list of very useful information that will save valuable time to the new user is given.
Trackers: Each tracker or device used in the room is associated with a logical name. The signals of these trackers are processed in various ways, some on Cadomin itself and some on other machines that are connected via different ports to Cadomin. The file servertab located in /usr/cadomin/misc/graphics/MR/etc contains the listing of all the devices and the ports to which the connect to. In the case that a tracker or a button is not responding consulting this table can serve as a basis for finding the problem.
The workspace file: This file contains the information that is needed for a proper mapping of all the devices. It contains transformation matrixes that tells the MR-Toolkit how to interpret the raw signals.
The *.map file: In the second phase of this project many problems relating to clipping were encountered. Using OpenGL one specifies the viewing volume by a call to glFrustom() with the appropriate parameters. This does not work well with MR-Toolkit. When an application is run in VizRoom, the window manager automatically searches the current directory for a file with the same name as that of the running application and a .map extension. As an example of this map file, this is a portion of the one used for our application:
trigger xup console (X)
trigger xdown console(x)
display front projectionf
fov 85
clipping 0.05 10.0
display cadomin:0.0
size 1024 500
position 1 1
lowerright -2.3 0.32 0.25
upperleft -0.84 -2.15 2.496
As seen here, MR-Toolkit sets the clipping planes by reading an external file, there is no need for any OpenGL function calls. It is important to note that this set up can be changed at any time without having to recompile and link the source code.
11. Special Thanks
It would have been extremely difficult to complete this project without the help of some graduate students and faculty members. I would like to thank:
Finally I would like to thank Dr. Zaiane for his continuous positive support throughout the project, and also for suggesting this as a project topic. If it was not for his motivation, I probably would have never had this valuable experience.
12. Terms Defined
13. Bibliography
http://www.almaden.ibm.com/u/ragrawal/papers/vldb96_cube.ps
14. Source Code
#include <MR/mr.h>
#include <GL/gl.h>
#include <stdlib.h>
#define pSpeed 1.5; /* Pointer sensitivity *//*static int Height = 700;
static int Width = 800;
*/
static float gridWidth = 16; /* Try to keep these (2k) K is int */
static float gridDepth = 48;
static float gridHight = 10;
static float gap = 0.2857; /* 2.0/7.0 */
static int xTrig, yTrig, zTrig;
static int time_level, product_level, location_level;
int Width = 1024;
int Height = 768;
static float scale;
/* Mining stuff */static int summW, summH, summD;
int sales [4][12][16][10];
int aggrigate [48][16][10];
extern MR2_Display MR2_get_display(char *);
/*
void PrintString (char *s, int x, int y);
void MakeRasterFont(void);
*//* ****************************************************
*******************************************************
*******************************************************
Group-by's & Cube/Cuboid Creation
*******************************************************
*/void get_monthly_sales () {
int y, m, p, l;for (y = 0; y < 4; y++)
for (m = 0; m < 12; m++)
for (p = 0; p < 16; p++)
for (l = 0; l < 10; l++)
sales [y][m][p][l] = rand () % 150;}
void init_aggrigates () {
int m, p, l;for (m = 0; m < 48; m++)
for (p = 0; p < 16; p++)
for (l = 0; l < 10; l++)
aggrigate [m][p][l] = -1;
}int groupby_month_region_pName (){
int y, m, p, l, t;summW = 16; summH = 10; summD = 48;
for (y = 0; y < 4; y++)
for (m = 0; m < 12; m++) {
t = 12*y + m;
for (p = 0; p < 16; p++)
for (l = 0; l < 10; l++)
aggrigate [t][p][l] = sales [y][m][p][l];
}
}
/* -------------------------------------------------------------- */
int groupby_month_region_pType () {
int pType, t, sum, y, p, m, l;summW = 8; summH = 10; summD = 48;
for (y = 0; y < 4; y++)
for (m = 0; m < 12; m++) {
t = 12*y + m;
for (l = 0; l < 10; l++) {
pType = 0;/* ---------- COMP -------- */
sum = 0;
for (p = 0; p < 3; p++)
sum += sales [y][m][p][l];
aggrigate [t][pType++][l] = sum;/* ----------- FAX -------- */
sum = 0;
for (p = 3; p < 5; p++)
sum += sales [y][m][p][l];
aggrigate [t][pType++][l] = sum;/* ---------- COPY -------- */
sum = 0;
for (p = 5; p < 7; p++)
sum += sales [y][m][p][l];
aggrigate [t][pType++][l] = sum;/* ---------- KITCH ------- */
sum = 0;
for (p = 7; p < 9; p++)
sum += sales [y][m][p][l];
aggrigate [t][pType++][l] = sum;/* ---------- HOUS -------- */
p = 9;
aggrigate [t][pType++][l] = sales [y][m][p][l];/* ---------- TV -------- */
sum = 0;
for (p = 10; p < 12; p++)
sum += sales [y][m][p][l];
aggrigate [t][pType++][l] = sum;/* ---------- STER -------- */
sum = 0;
for (p = 12; p < 14; p++)
sum += sales [y][m][p][l];
aggrigate [t][pType++][l] = sum;/* ---------- CAR -------- */
sum = 0;
for (p = 14; p < 16; p++)
sum += sales [y][m][p][l];
aggrigate [t][pType++][l] = sum;
}
}
}/* ============================================================ */
int groupby_month_region_pCat () {
int pCat, t, sum, y, m, p, l;summW = 3; summH = 10; summD = 48;
for (y = 0; y < 4; y++)
for (m = 0; m < 12; m++) {
t = 12*y + m;
for (l = 0; l < 10; l++) {
pCat = 0;sum = 0;
for (p = 0; p < 7; p++)
sum += sales [y][m][p][l];
aggrigate [t][pCat++][l] = sum;
sum = 0;
for (p = 7; p < 10; p++)
sum += sales [y][m][p][l];
aggrigate [t][pCat++][l] = sum;
sum = 0;
for (p = 10; p < 16; p++)
sum += sales [y][m][p][l];
aggrigate [t][pCat++][l] = sum;
}
}
}
/* New */
/* ============================================================ */
int groupby_month_country_pName () {
int y, m, p, l, t, sum, country;
summW = 16; summH= 2; summD= 48;
for (y = 0; y < 4; y++)
for (m = 0; m < 12; m++) {t = 12*y + m;
for (p = 0; p < 16; p++) {
country = 0;sum = 0;
for (l = 0; l < 5; l++)
sum += sales [y][m][p][l];
aggrigate [t][p][country++] = sum;
sum = 0;
for (l = 5; l < 10; l++)
sum += sales [y][m][p][l];
aggrigate [t][p][country] = sum;
}
}
}/* ============================================================ */
int groupby_month_country_pType () {
int y, m, p, l, t, sum, pType;
int temp [48][8][2]; /* t, p, l */groupby_month_region_pType ();
for (t = 0; t <48; t++)
for (p = 0; p < 8 ; p++) {sum = 0;
for (l = 0; l < 5; l++)
sum += aggrigate [t][p][l];
temp[t][p][0] = sum;
sum = 0;
for (l = 5; l < 10; l++)
sum += aggrigate [t][p][l];
temp[t][p][1] = sum;
}summW = 8; summH =2; summD = 48;
for (t = 0; t < 48; t++)
for (p = 0; p < 8; p++)
for (l = 0; l < 2; l++)
aggrigate [t][p][l] = temp [t][p][l];
}/* ============================================================ */
int groupby_month_country_pCat () {
int t, p, l, sum;
int temp [48][3][2]; /*t, p, l */groupby_month_region_pCat();
for (t = 0; t <48; t++)
for (p = 0; p < 3 ; p++) {sum = 0;
for (l = 0; l < 5; l++)
sum += aggrigate [t][p][l];
temp[t][p][0] = sum; /* first 5 regions */sum = 0;
for (l = 5; l < 10; l++)
sum += aggrigate [t][p][l]; /* Second five regions */
temp[t][p][1] = sum;
}summW = 3; summH =2; summD = 48;
for (t = 0; t < 48; t++)
for (p = 0; p < 3; p++)
for (l = 0; l < 2; l++)
aggrigate [t][p][l] = temp [t][p][l];
}
/* ============================================================ */
int groupby_year_region_pName () {int temp [4][16][10]; /*t, p, l */
int p, l, y, m, sum;groupby_month_region_pName();
for (p = 0; p < 16; p++)
for (l = 0; l < 10; l++)
for (y = 0; y < 4; y++) {
sum = 0;
for (m = 12*y; m < (12*y + 12); m++)
sum += aggrigate [m][p][l];temp [y][p][l] = sum;
}summW = 16; summH = 10; summD = 4;
for (y = 0; y < 4; y++)
for (p = 0; p < 16; p++)
for (l = 0; l < 10; l++)
aggrigate [y][p][l] = temp [y][p][l];
}
/* ============================================================ */
int groupby_year_region_pType () {int temp [4][8][10]; /*t, p, l */
int p, l, y, m, sum;groupby_month_region_pType();
for (p = 0; p < 8; p++)
for (l = 0; l < 10; l++)
for (y = 0; y < 4; y++) {
sum = 0;
for (m = 12*y; m < (12*y + 12); m++)
sum += aggrigate [m][p][l];temp [y][p][l] = sum;
}summW = 8; summH = 10; summD = 4;
for (y = 0; y < 4; y++)
for (p = 0; p < 8; p++)
for (l = 0; l < 10; l++)
aggrigate [y][p][l] = temp [y][p][l];}
/* ============================================================ */
int groupby_year_region_pCat () {int temp [4][8][10]; /*t, p, l */
int p, l, y, m, sum;groupby_month_region_pCat ();
for (p = 0; p < 3; p++)
for (l = 0; l < 10; l++)
for (y = 0; y < 4; y++) {
sum = 0;
for (m = 12*y; m < (12*y + 12); m++)
sum += aggrigate [m][p][l];temp [y][p][l] = sum;
}summW = 3; summH = 10; summD = 4;
for (y = 0; y < 4; y++)
for (p = 0; p < 3; p++)
for (l = 0; l < 10; l++)
aggrigate [y][p][l] = temp [y][p][l];}
/* ============================================================ */
int groupby_year_country_pName () {int temp [4][16][2]; /*t, p, l */
int p, l, y, m, sum;groupby_month_country_pName ();
for (p = 0; p < 16; p++)
for (l = 0; l < 2; l++)
for (y = 0; y < 4; y++) {
sum = 0;
for (m = 12*y; m < (12*y + 12); m++)
sum += aggrigate [m][p][l];temp [y][p][l] = sum;
}summW = 16; summH = 2; summD = 4;
for (y = 0; y < 4; y++)
for (p = 0; p < 16; p++)
for (l = 0; l < 2; l++)
aggrigate [y][p][l] = temp [y][p][l];
}
/* ============================================================ */
int groupby_year_country_pType () {int temp [4][8][2]; /*t, p, l */
int p, l, y, m, sum;groupby_month_country_pType ();
for (p = 0; p < 8; p++)
for (l = 0; l < 2; l++)
for (y = 0; y < 4; y++) {
sum = 0;
for (m = 12*y; m < (12*y + 12); m++)
sum += aggrigate [m][p][l];temp [y][p][l] = sum;
}summW = 8; summH = 2; summD = 4;
for (y = 0; y < 4; y++)
for (p = 0; p < 8; p++)
for (l = 0; l < 2; l++)
aggrigate [y][p][l] = temp [y][p][l];}
/* ============================================================ */
int groupby_year_country_pCat () {int temp [4][3][2]; /*t, p, l */
int p, l, y, m, sum;groupby_month_country_pCat ();
for (p = 0; p < 3; p++)
for (l = 0; l < 2; l++)
for (y = 0; y < 4; y++) {
sum = 0;
for (m = 12*y; m < (12*y + 12); m++)
sum += aggrigate [m][p][l];
temp [y][p][l] = sum;
}
summW = 3; summH = 2; summD = 4;
for (y = 0; y < 4; y++)
for (p = 0; p < 3; p++)
for (l = 0; l < 2; l++)
aggrigate [y][p][l] = temp [y][p][l];}
/* ***************************************************************** */
/* ***************************************************************** */
void make_cuboid () {
int cuboid, t, p, l;t = time_level * 3;
p = product_level * 2;
l = location_level * 9;cuboid = t + p + l; /* Unique sum for every cuboid */
switch (cuboid) {
case 0: groupby_year_country_pCat ();
scale = 100000.00;
break;case 9: groupby_year_region_pCat ();
scale = 10000.00;
break;case 2: groupby_year_country_pType ();
scale = 100000.00;
break;case 11:groupby_year_region_pType ();
scale = 10000.00;
break;case 4: groupby_year_country_pName ();
scale = 10000.00;
break;case 13:groupby_year_region_pName ();
scale = 10000.00;
break;/* Where t = 1 <== month level */
case 3: groupby_month_country_pCat ();
scale = 10000.00;
break;case 12:groupby_month_region_pCat ();
scale = 1000.00;
break;case 5: groupby_month_country_pType ();
scale = 1000.00;
break;case 14:groupby_month_region_pType ();
scale = 1000.00;
break;case 7: groupby_month_country_pName ();
scale = 100.00;
break;case 16:groupby_month_region_pName ();
scale = 100.00;
break;}
}/* ***************************************************************** */
void flip_time () {
if (time_level > 0)
time_level = 0;
else
time_level = 1;
}void flip_product () {
product_level++;
if (product_level > 2)
product_level = 0;}
void flip_location () {
if (location_level > 0)
location_level = 0;
else
location_level = 1;
}
/* ***************************************************************** */
void draw_cube(float cx, float cy, float cz, float s) {
float x, y, z;
glBegin(GL_QUADS);
glColor3f(1.0,0.0,0.0);
x = cx + s/2;
glVertex3f(x,cy-s/2,cz-s/2);
glVertex3f(x,cy+s/2,cz-s/2);
glVertex3f(x,cy+s/2,cz+s/2);
glVertex3f(x,cy-s/2,cz+s/2);glColor3f(0.0,1.0,0.0);
y = cy + s/2;
glVertex3f(cx-s/2,y,cz-s/2);
glVertex3f(cx+s/2,y,cz-s/2);
glVertex3f(cx+s/2,y,cz+s/2);
glVertex3f(cx-s/2,y,cz+s/2);glColor3f(0.0,0.0,1.0);
z = cz + s/2;
glVertex3f(cx-s/2,cy-s/2,z);
glVertex3f(cx+s/2,cy-s/2,z);
glVertex3f(cx+s/2,cy+s/2,z);
glVertex3f(cx-s/2,cy+s/2,z);glColor3f(0.0,1.0,1.0);
x = cx - s/2;
glVertex3f(x,cy-s/2,cz-s/2);
glVertex3f(x,cy+s/2,cz-s/2);
glVertex3f(x,cy+s/2,cz+s/2);
glVertex3f(x,cy-s/2,cz+s/2);glColor3f(1.0,0.0,1.0);
y = cy - s/2;
glVertex3f(cx-s/2,y,cz-s/2);
glVertex3f(cx+s/2,y,cz-s/2);
glVertex3f(cx+s/2,y,cz+s/2);
glVertex3f(cx-s/2,y,cz+s/2);glColor3f(1.0,1.0,0.0);
z = cz - s/2;
glVertex3f(cx-s/2,cy-s/2,z);
glVertex3f(cx+s/2,cy-s/2,z);
glVertex3f(cx+s/2,cy+s/2,z);
glVertex3f(cx-s/2,cy+s/2,z);
glEnd();
}
/*
float get_scale () {
float s = 10000.00;if ((time_level + product_level + location_level) == 0)
return (100000.00);if (time_level == 1) && (
s = 10000.00;if (product_level == 2)
s /= 100.00;if ((product == 1) && (time == 1))
return (s);
}
*/void draw_grid() {
float x, y, z, s;
float cube_gap = 0.29;
float D, H, W;
int t, p, l;D = (cube_gap * (float) summD) - 1.00;
H = (cube_gap * (float) summH);
W = (cube_gap * (float) summW) - 1.00;
/*if (D != 1) exit (0);
if (H !=
*/
t = p = l = 0;for(x = -D, t = 0; x < 1.00; x += cube_gap, t++)
for(y = -1.0, p = 0; y < W; y += cube_gap, p++)
for(z = 0.0, l = 0; z < H; z += cube_gap, l++) {
/*if (t > summD || p > summW || l > summH)
x = y = z = (H + D + W);
*/
s = (aggrigate [t][p][l]/scale);
if ( s < 0.010)s = 0.00010;
if (s > 0.155) s = 0.155;
draw_cube(x,y,z, s ); /*0.080); 0.125 */
}
}
/* ---------------------------------------------------------------Puts the pointer in the world
*/void draw_pointer (float x, float y, float z, float measure) {
x *= pSpeed; y *= pSpeed; z *= pSpeed;
glColor3f (1.0, 1.0, 1.0);
glPointSize (30.0);
glBegin (GL_POINTS);
glVertex3f (x, y, z);
glEnd();/*
glBegin(GL_QUADS);
glVertex3f (x, y, z);
glVertex3f (x + measure, y, z);
glVertex3f (x + measure, y, z + measure);
glVertex3f (x, y, z + measure);
*/
glEnd();
/*
PrintString (" ********** Hello *******",1 , 1);
*/
}/* ----------------------------------------------------------------
w = Width
h = hight
d = depth
dim = the dim of the super cube (use 2.0)
*/void draw_wireGrid() {
float x, y, z, xMax, xMin, yMax, yMin;
glClearColor(0.0, 0.0, 0.0, 0.0);
glClear(GL_COLOR_BUFFER_BIT | GL_DEPTH_BUFFER_BIT);
xMax = 1.0; xMin = (float) (1 - gridDepth); /* Back wall in -x */
yMax = (float)(gridWidth - 1); yMin = -1.0; /* Left wall is in -y */glColor3f (1.0,1.0,1.0);
if (xTrig) glColor3f (1.0,0.0,0.0);
if (yTrig) glColor3f (0.0,1.0,0.0);
if (zTrig) glColor3f (0.0,0.0,1.0);
glBegin (GL_LINES); /* x gaps */
for (x = xMin; x <= xMax; x += gap) {
glVertex3f (x, yMax, 0.0);
glVertex3f (x, yMin, 0.0);glVertex3f (x, yMin, 0.0);
glVertex3f (x, yMin, gridHight);
}for (y = yMin; y <= yMax; y += gap) {
glVertex3f (xMax, y, 0.0);
glVertex3f (xMin, y, 0.0);
glVertex3f (xMin, y, 0.0);
glVertex3f (xMin, y, gridHight);
}for (z = 0.0; z <= gridHight; z += gap) {
glVertex3f (xMax, yMin, z);
glVertex3f (xMin, yMin, z);glVertex3f (xMin, yMin, z);
glVertex3f (xMin, yMax, z);
}
glEnd();
}/* ---------------------------------------
This function will measure the pointer position, using a threshold
it will trigger the x, y or z axis as being selected. The presedence of triggering is as following: - Y-axis; X-axis; Z-axis.
--------------------------------------- */void check_for_input (float x, float y, float z) {
int xThreshold = -0.40;
int yThreshold = -0.40;
int zThreshold = 0.40;xTrig = yTrig = zTrig = 0; /* No Trigger */
if (y <= yThreshold) {
xTrig = 0;
yTrig = 1;
zTrig = 0;
return;
}if (x <= xThreshold) {
xTrig = 1;
yTrig = 0;
zTrig = 0;
return;
}if (z >= zThreshold) {
yTrig = 0;
xTrig = 0;
zTrig = 1;
return;
}}
/* --------------------------------------------- */
void init_mine () {
get_monthly_sales ();
time_level = 0;
product_level = 1;
location_level = 1;
make_cuboid ();
}/* ================================================= */
main(int argc, char **argv) {
MR2_Display front;
MR2_Display right;
MR2_Display left;
MR_Device pointer;
MR_Device xAx, yAx, zAx;
MR_Device quit;
MR_Device head;
int running = 1;
float x, y, z, px, py, pz;
float width, hight, depth;
float size;
float oldX, oldY;
int n;x = y = 0.0;
z = 1.0;
size = 0.1;
n = 6;if(argc > 1) {
x = atof(argv[1]);
y = atof(argv[2]);
z = atof(argv[3]);
}if(argc > 4) {
size = atof(argv[4]);
}MR_init(&argc, argv);
init_mine ();pointer = MR_bind_name("pointer");
xAx = MR_bind_name("xAx");
yAx = MR_bind_name("yAx");
zAx = MR_bind_name("zAx");
quit = MR_bind_name("exit");
head = MR_bind_name("head");front = MR2_get_display("front");
right = MR2_get_display("right");
left = MR2_get_display("left");MR2_display_initialize(front);
MR2_display_initialize(right);
MR2_display_initialize(left);MR_clear_device_set();
MR_configure();
while(!navigate()) {
MR_update_device(quit); /* The e on the Keyboard */
if(quit->trigger){
running = 0;
break;
}MR_update_device(xAx); /* The first button */
if(xAx->trigger){
flip_time();
make_cuboid ();
}MR_update_device(yAx); /* The middle button */
if(yAx->trigger){
flip_product ();
make_cuboid ();
}MR_update_device(zAx); /* The last button */
if(zAx->trigger){
flip_location ();
make_cuboid ();
}MR_update_device (pointer);
px = (float) pointer -> value -> x;
py = (float) pointer -> value -> y;
pz = (float) pointer -> value -> z;/* check_for_input (px, py, pz);
*/
/*
px = (oldX * sin(-0.53379))+
(oldY * cos(-0.53379));
py = (oldX * cos(-0.53379))-
(oldY * sin(-0.53379));
*/MR_update_device(head);
/* Transform room coo. to wall coo.
oldX = head -> value -> x;
oldY = head -> value -> y;head->value->y = (oldX * sin(-0.53379))+
(oldY * cos(-0.53379));
head->value->x = (oldX * cos(-0.53379))-
(oldY * sin(-0.53379));
*/
/*
head->value->x *= 1.5;
head->value->y *= 1.5;
*/
/* -------------------------------------------------------------D R A W O N E I M A G E S F O R E A C H E Y E O N
A L L T H R E E W A L L S
-------------------------------------------------------------
*/width = 7; hight = 7; depth = 7;
/* ------------------------ FRONT ------------------------------ */
MR2_start_left(front,head->value);
draw_wireGrid ();
draw_grid();
draw_pointer (px, py, pz, 0.1);MR2_start_right(front,head->value);
draw_wireGrid ();
draw_grid();
draw_pointer (px, py, pz, 0.1);
MR2_end_display(front);/* ------------------------ RIGHT ----------------------------- */
MR2_start_left(right,head->value);
draw_wireGrid ();
draw_grid();
draw_pointer (px, py, pz, 0.1);MR2_start_right(right,head->value);
draw_wireGrid ();
draw_grid ();
draw_pointer (px, py, pz, 0.1);
MR2_end_display(right); /* Right stereo *//* ------------------------- LEFT ---------------------------- */
MR2_start_left(left,head->value);
draw_wireGrid ();
draw_grid();
draw_pointer (px, py, pz, 0.1);MR2_start_right(left,head->value);
draw_wireGrid ();
draw_grid();
draw_pointer (px, py, pz, 0.1);
MR2_end_display(left); /* Left Stereo */}
MR_terminate(0);
}
|
|