Please Reference the Following Paper:
- Hilderman, R.J., and Hamilton, H.J. ``Heuristic Measures of Interestingness.'' In Third European Symposium on Principles of Data Mining and Knowledge Discovery (PKDD'99), Prague, Czech Republic, Springer Verlag, September, 1999, 232-241.
Introduction
The sixteen measurses that make up the HMI set come from the areas of economics, ecology, and information theory. Collectively, we refer to these sixteen measures as the HMI set (i.e., heuristic measures of interestingness).
The measures can be used for more than just ranking the interestingness of generalized relations using domain generaliztion graph. For example, alternative methods could be used to guide the generation of summaries, such as Galois lattices, conceptual graphs, or formal concept analysis. Also, summarties could more generally include views generated from databases or summary tables generated from data cubes.
Sixteen Characteristics of the HMI Set
Each measure shares three important properties
- Depends only on the frequency distribution or probability distribution of the values in the derived Count attribute of the summary to which it is being applied.
- Allows a value to be generated with at most one pass through the summary.
- Is independent of any specific units of measure.
- Let m be the total number of tuples in a summary
- Let ni be the value contained in the Count attribute for tuple ti
- Let N be the total count
- Let p be the observed probability (i.e. relative frequency) distribution of the tuples Based on the values ni
- Let pi = ni / N be the observed probability for tuple ti
- Let q be a uniform probability distribution of the tuples
- Let u = N / m be the count for tuple ti, i = 1,2,...,m according to the uniform distribution q
- Let q-bar = 1 / m be the probability for tuple ti, i = 1,2,...,m according to the uniform distribution q
- Let r be the probability distribution obtained by combining the values ni and u
- Let ri = (ni + u) / 2N, be the probability for tuples ti, for all i = 1,2,...,m according to distribution r
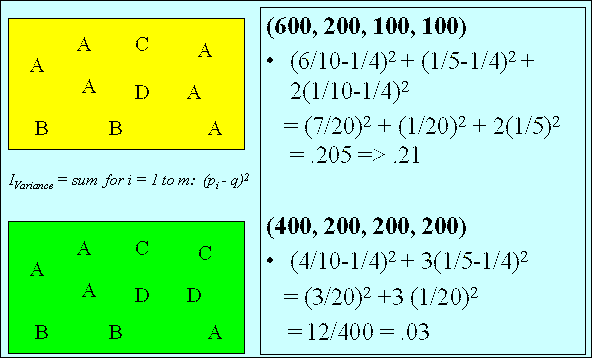
IVariance
Based on the sample variance from classical statistics,
IVariance measures the
weighted average of the squared deviations of the probabilities
pi
from the mean probability q-bar,
where the weight assigned to each squared deviation is 1/(m - 1).


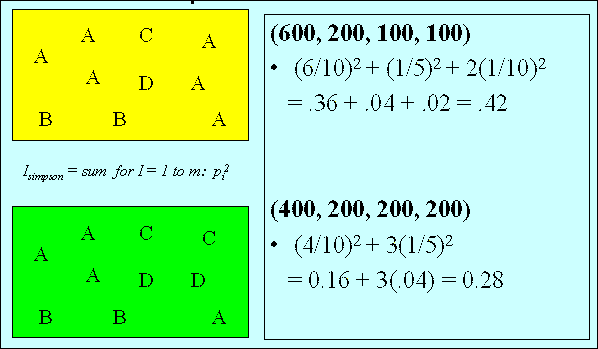
ISimpson
A variance-like measure based on the Simpson index,
ISimpson measures the extent
to which the counts are distributed
over the tuples in a summary,
rather than being
concentrated in any single one of them.


IShannon
Based on a relative entropy measure from information theory (known as the Shannon index),
IShannon measures the average information content in the tuples of a summary.

ITotal
Based on the Shannon index from information theory, ITotal measures the
total information content in a summary.

IMax
Based on the Shannon index from information theory, IMax measures the maximum
possible information content in a summary.

IMcIntosh
Based on a heterongeneity index from ecology, IMcIntosh views the
counts in a summary as the coordinates of a point in a multidimensional space and
measures the modified Euclidean distance from this point to the origin.

ILorenz
Based on the Lorenz curve from statistics, economics, and social science, ILorenz measures
the average value of the Lorenz curve derived from the probabilities pi associated with the
tuples in a summary. The Lorenz curve is a series of straight lines in a square of unit length, starting from
the origin and going successively to points (p1,q1),(p1 + p2, q1
+ q2), . . .. When the pi's are all equal, the Lorenz curve coincides with the diagonal
that cuts the unit square into equal halves. When the pi's are not all equal, the Lorenz curve
is below the diagonal.

IGini
Based on the Gini coefficient which is defined in terms of the Lorenz curve,
IGini measures the ratio of the area between the diagonal (i.e.,
the line of equality) and Lorenz curve, and the total area below the diagonal.

IBerger
Based on a dominance index from ecology, IBerger measures the
proportional dominance of the tuple in a summary with the highest probability pi

ISchutz
Based on an inequality measure from the economics and social science, ISchutz
measures the relative mean deviation of the observed distribution of the counts in a summary from a
uniform distribution of the counts.

IBray
Based on a community similarity index from the ecology, IBray measures
the percentage of similarity between the observed distribution of the counts in a summary
and a uniform distribution of the counts.

IWhittaker
Based on a community similarity index from ecology, IWhittaker measures
the fraction of similarity between the observed distribution of the counts in a summary
and a uniform distribution of the counts.

IKullback
Based on a distance measure from information theory, IKullback measures
the distance between the observed distribution of the counts in a summary and a uniform distribution
of the counts.

IMacArthur
Based on the Shannon index from information theory, IMacArthur combines two summaries, and then
measures the difference between the amount of information contained in the combined distribution and the amount
of contained in the average of the two original distributions.

ITheil
Based on a distance measure from the information theory, ITheil measures
the distance between the observed distribution of the counts in a summary and a uniform distribution
of the counts.

IAtkinson
Based on a measure of inequality from economics, IAtkinson measures the percentage
to which the population in a summary would have to be increased to achieve the same level of interestingness
as if the counts in the summary were uniformly distributed.


