In honour of the 1995 Canadian Math Society Winter Meeting, Simon Fraser University presents:
MATH-ART: 9 December 1995 — 24 January 1996
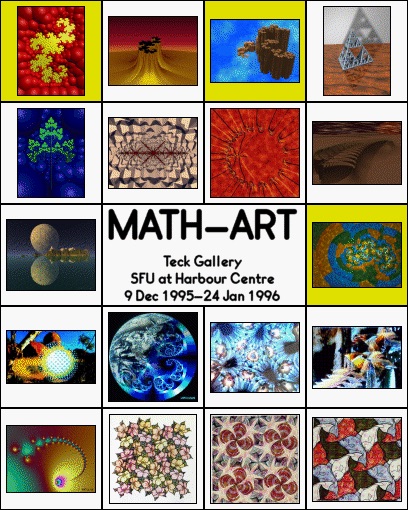
Scroll down for more information about the exhibit (those images on a yellow background have extra information about how they were created).
Introduction
Mandates of art galleries are many, but the mandate that immediately defines a university gallery is the mandate that a gallery demonstrates the aesthetic dimensions of academic disciplines. It was to this end that Simon Fraser Gallery mounted its first math art exhibition, EXPLORING THE IMAGE WORLD OF COMPUTER GRAPHICS, with works by Daryl Hepting (and others from the Graphics and Multimedia Research Lab in the School of Computing Science), in the W.A.C. Bennett Gallery, May 30 to July 26, 1994.
Daryl Hepting, a Ph.D. Candidate in the School of Computing Science and one of the four curators of this exhibition, knows the connections between computers and aesthetics as few in Simon Fraser University can. He takes us on a short course on math art in the notes on these digital graphics.
Other members of Simon Fraser University who joined me in curating this exhibition were Dr. Katherine Heinrich, Chair of Mathematics & Statistics and Dr. Malgorzata Dubiel of the same department.
These eighteen images were selected from scores of possible images so as to represent the complexities and contrasts of visual aesthetics that are possible in digital graphics. They were also selected to represent the images that are available from three sources on the WORLD WIDE WEB (internet): computer art exhibits, pioneer publications, and computer images created by Daryl Hepting of Simon Fraser University.
Simon Fraser Gallery is grateful for the assistance of Gallery staff, Daryl Hepting, and the other curators for making this exhibition possible. It is also grateful to the Graphics and Multimedia Research Lab for production assistance. The Teck and Simon Fraser Galleries are honoured to support the Department of Mathematics & Statistics in hosting the Canadian Mathematical Society 1995 Winter Meeting.
Dr. Edward Gibson, Director, December 1995.
Notes on Exhibition
The majority of works in this exhibition represent a collection which rely on the computer for their existence. And the computer involves mathematics to describe, manipulate, and translate even the simplest scenes into the forms we see here. The involvement of mathematics plays a greater role in these works — it provides the inspiration and the foundation upon which they are constructed.
A prominent feature of the exhibit is its display of fractals, objects from a non-Euclidean geometry. Fractals — sharing a root with fracture and fraction ‐ have been called the geometry of nature by Mandelbrot, who discovered their capability to describe the non-smooth world in which we live. Fractal geometry, which is new to us, has shed light on old things — things like the historical record of water levels in the Nile river for instance. And in its turn the computer has shed light on fractals, allowing the underlying beauty of what may seem to be dry-as-dust mathematics to shine through. Works like Blessed State or Steps to Infinity provide evidence of the profound connection that seems to exist between fractals and the natural world.
It is fitting that this collection of computer-related art comes to us in large part through the internet (the World Wide Web). Although Daryl Hepting is now at SFU, his works are distributed widely across the internet. In addition to Hepting’s collaborations with Musgrave (George Washington University), Prusinkiewicz (University of Calgary), Saupe (University of Freiburg), and Snider (University of Regina), the computer-based works come from:
- Contours of the Mind: A Celebration of Fractals, Feedback and Chaos
- SITO: the operative term is “stimulate”
- The Fractals Calendar
The other pieces in this exhibit remind the viewer that the computer is responsible for only a portion of all mathematical art. The works of M. C. Escher and Marjorie Rice offer a beautiful expression of this fact.
Partial financial support for the exhibit at Harbour Centre was provided by the British Columbia Ministry for Employment and Investment.
Fiery Dragon (1990)
by Daryl H. Hepting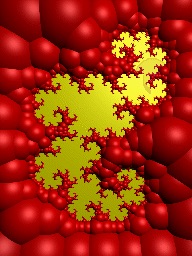
Martin Gardener tells the story of how this curve, first discovered by John E. Heighway, used by William G. Harter as a decoration symbolic of cryptic structure, and later analysed by them and another colleague, Bruce A. Banks. Though its final structure is complex, its description is not. The following two transformations are required to generate this shape:
        xform
        	scale { sqrt(2)/2 }
        	rotate -45

        xform
        	scale { sqrt(2)/2 }
        	rotate 135
        	translate 1.0 0.0
Beginning with a single point, the whole curve can be generated by repeated application of these two transformations. This specification of the shape in terms of contractive, affine transformations is called an iterated function system (IFS).
This image of a dragon curve was created by covering with disks (spheres) the parts of the plane which do not include the fractal. These parts are determined by computing the minimum distance from a point P to the fractal. If this distance is d, then a disk of radius d can be drawn about the point P and all points inside that disk are known not to belong to the fractal.
The following movie illustrates this process at work.
Like many of my other works, I've used rayshade to ray-trace this image. This process creates the final image (which you see above) by simulating a camera inside the computer.
Dragon Mesa (1989)
by Przemyslaw Prusinkiewicz, Dietmar Saupe, and Daryl H. Hepting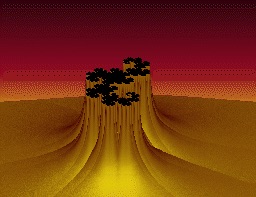
Steps to Infinity (1994)
by Daryl H. Hepting and F. Kenton Musgrave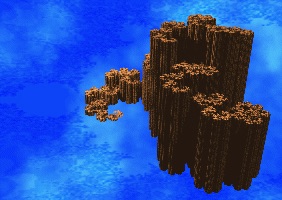
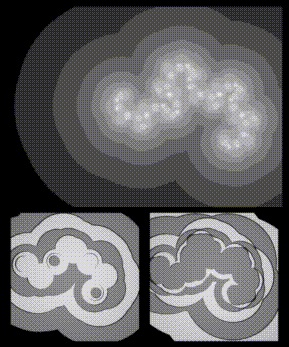
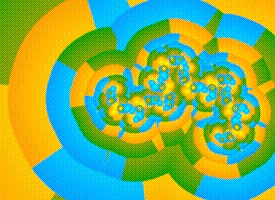
The steps in this image come from a dragon curve, like the one seen on the poster for this event (and described in the notes for Fiery Dragon. Below, I show two different colourings for a dragon curve in the plane. The curve is made up of smaller and smaller copies of itself, as the colourings indicate.
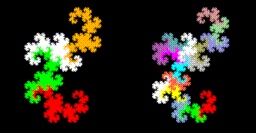
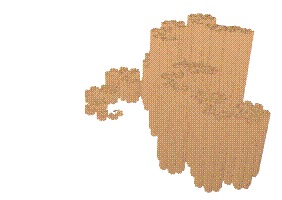
There are two transformations which define the dragon curve each small dragon seen above can be described by a sequence of these two transformations. To create the steps, I've assigned a unique height to each small dragon. Below, I show the steps inside a white sphere, which represents the sky. It doesn't look much like a very believable sky here, but I'll fix that. The lighting I've used here is much simpler than in the final image and it shows.
If you look carefully at Steps to Infinity, you will notice (part of) a Mandelbrot set in the sky, amongst the clouds. I began with a portion of the Mandelbrot set, shown below. It may be familiar to you from Ken Musgrave's image on the cover of the 1994 Fractals Calendar. In this case, I've changed to colours more appropriate for a blue sky.
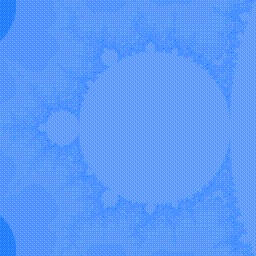
For the next step, I've mapped the square image onto the inside of a white sphere, which will represent the dome of the sky in the model of my scene. Notice that this image is considerably lighter than the first, and this is due only to the white colour of the original sphere.

I create some clouds for the sky by using a fractal texture function which selects blues and whites for each pixel based on something called fractional Brownian motion.
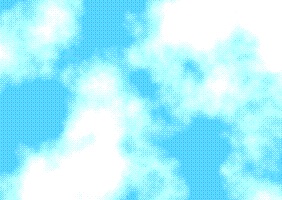
When the clouds are combined with the Mandelbrot set image, the final Mandelbrot sky image comes to life.
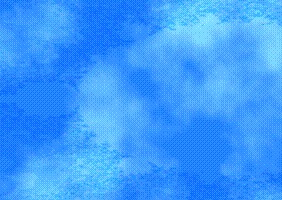
And the final image once again...

Desktop Tetrahedron (1990)
by Daryl H. Hepting and Allan Snider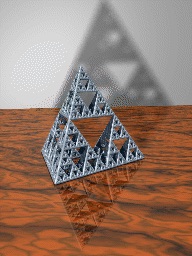
Carrot in Blue (1991)
by Daryl H. Hepting and Przemyslaw Prusinkiewicz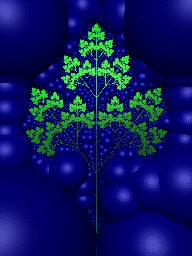
Fractal Emblem (1992)
by Daryl H. Hepting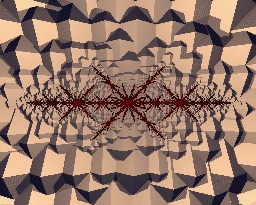
Splash (1993)
by F. Kenton Musgrave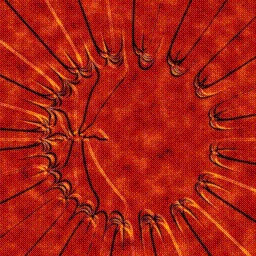
The Great Fern Dune (1994)
by Daryl H. Hepting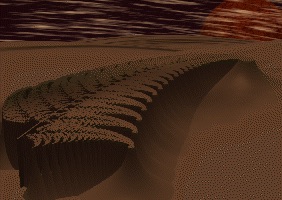
Blessed State (1988)
by F. Kenton Musgrave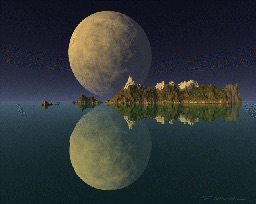
Captivating Rhythm (1995)
by Daryl H. Hepting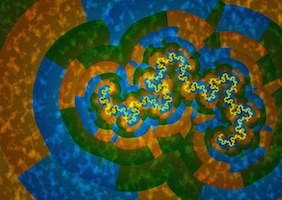
xform
	scale 0.618	    /* Dragon scales by approximately .7071 */
	rotate -137.5

xform
	scale -0.618
	rotate 137.5
	translate 1.0 0.0
I've illustrated this process in the following movie, using cones to show the effect of the transformations. As the strength of a transformation increases, a cone under that transformation gets wider and shorter.
Untitled
by Stan Ostoja-KotkowskI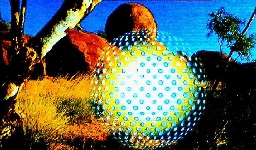
Fractal World (1994)
by L. Kerry Mitchell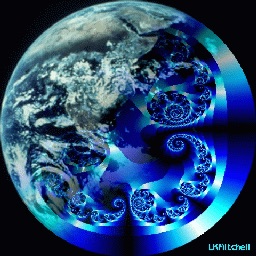
Anemones (1992)
by Kevin Suffern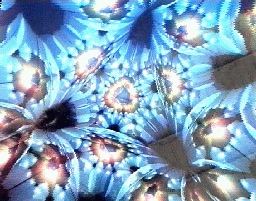
The Subject of All Objects (1994)
by Sophie Anapliotis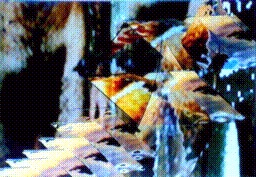
Gravity (1994)
by L. Kerry Mitchell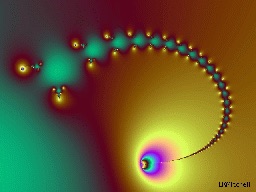
Ingenious mathematical amateurs
A talk by Dr. Doris Schattschneider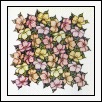
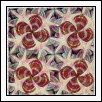
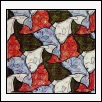
It is possible for someone without formal credentials to make contributions to mathematics. Well-known artist M.C. Escher and unknown homemaker Marjorie Rice both tackled mathematical problems, developing unorthodox notation that was essential to their methodical investigations. Each worked alone, essentially in secret, rewarded by the exhilaration of finding answers to a large puzzle.
Lecture by Dr. Doris Schattschneider,
Professor of Mathematics, Moravian College.
5 - 6 pm, 9 December 1995,
Fletcher Challenge Canada Theatre (Room 1900), SFU Harbour Centre Campus.
These images will be on display as part of the MATH-ART exhibit.
References:
- Schattschneider, Doris. M.C. Escher: Visions of Symmetry, W. H. Freeman Company, 1990.
- Klarner, David A. (editor). The Mathematical Gardener, Wadsworth International, 1981.
